The views expressed in CAVU Café: Royboy’s Prose & Cons blog are those solely of the writer and are not necessarily shared by the Aviation Suppliers Association or the Association’s staff, members, or Board of Directors. About Roy Resto
It’s amazing how
fast this data accumulates in a short period of time, so here’s the latest
compilation in summary-highlights form for your reading pleasure.
Number of Laser Incidents in 2018
TSA Busiest Day Ever, And Various
Interesting Stats
Global Airlines 2019 Profit
Forecast Cut
European example of Trains
competing with Air Service
CFM56 Milestone Achievements
US Aerospace and Defense Industry
2018 Performance
Interesting Highlights From the
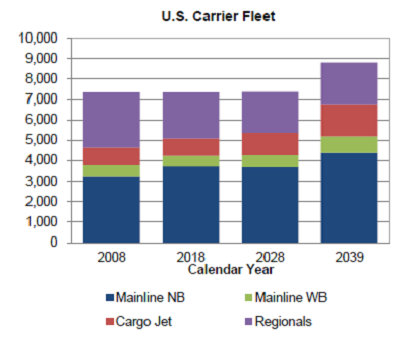
FAA Aerospace Forecast 2019-2039
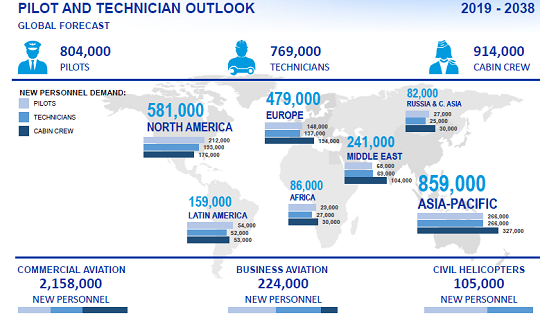
Boeing 2019-2038 Global Pilot and
Technician Outlook
Civil UAS (drone) Market Tripling
in Size by 2028
2019 EAA AirVenture Fly-in numbers
Cargo Drones Activity and Forecast
IATA Reveals Airlines Carried 4.4
Billion Passengers in 2018, and other stats
Global ACMI will reach $7.07 B by
2025
Amount of money left behind at
security checkpoints in 2018
Airline and Aviation stats
regarding going Green
Airbus forecast highlights
Number of
Laser Incidents in 2018 1
The FAA reported 5,663 laser
incidents in 2018, down from 6,754 in 2017 and 7,398 in 2016. However, the substantial
number of reported incidents clearly show that laser strikes on aircraft remain
a serious threat to aviation safety.
TSA Busiest
Day Ever, And Various Interesting Stats 2, 3
TSA checked 2,792,525 passengers
and crew members May 24, 2019 the last weekday before the long Memorial Day
weekend. On an average day, officers see 2.2 million people pass through
checkpoints.
Thanks to their vigilance and
skills, TSA officers intercepted a record number of firearms in 2018:
A record setting 4,239 total
firearms were discovered in carry-on bags at checkpoints across the country,
averaging 81.6 firearms per week. That’s an average of 11.6 firearms per day.
3,656 (86.15 percent) of the total
firearms discovered were loaded – another record.
1,432 (33.74 percent) of the total
firearms discovered had a round chambered.
The most firearms discovered in
one month – a record setting 32 – were discovered in August at
Hartsfield-Jackson Atlanta International Airport.
Firearms were intercepted at 249
of the 440 federalized airports.
That’s more than a 7 percent (282
more) increase in firearm discoveries from 2017’s total of 3,957.
Below are the top 10 airports that
led in firearm discoveries in 2018:
Hartsfield-Jackson Atlanta
International Airport (ATL): 298 – an increase of 53 compared to 2017 (253
loaded)
Dallas/Fort Worth International
Airport (DFW): 219 (193 loaded)
Phoenix Sky Harbor International
Airport (PHX): 129 (120 loaded)
Denver International Airport
(DEN): 126 (95 loaded)
Orlando International Airport
(MCO): 123 (112 loaded)
George Bush Intercontinental
Airport (IAH): 117 – a decrease of 25 firearms compared to 2017 (115 loaded)
Fort Lauderdale-Hollywood
International Airport (FLL): 96 (80 loaded)
Austin-Bergstrom International
Airport (AUS): 93 (76 loaded)
Dallas Love Field Airport (DAL):
89 (83 loaded)
Nashville International Airport
(BNA): 86 (80 loaded)
Global
Airlines 2019 Profit Forecast Cut 4
A combination of an escalating
trade war and increased oil prices saw global airlines cut profit 2019 forecasts
by 21% as the threat of an industry slowdown looms according to IATA which
represents 80% of the world’s air traffic through approximately 290 carriers.
In 2019 overall costs are expected
to grow by 7.4%, outpacing a 6.5% rise in revenues. As a result, net margins
are expected to be squeezed to 3.2% (from 3.7% in 2018). Profit per passenger
will similarly decline to $6.12 (from $6.85 in 2018).
European
example of Trains competing with Air Service 5
Scandinavian carriers face stiff
competition as a result of environmental awareness with an increase in the
number of travelers going by train. In 2018, train passengers increased by 1.5
million and passenger numbers have increased by 8 percent, year on year, for
the first quarter of 2019. In contrast and according to airport operator
Swedavia, domestic passenger numbers in Sweden fell by 3 percent.
CFM56
Milestone Achievements 6
More than
33,400 CFM56 engines delivered to date
On April 24,
1982, the first-ever airplane powered by CFM56 engines, a Delta Air Lines
DC-8-71 powered by the CFM56-2, took to the skies. In the years after that, CFM
International would go on to add seven additional engine models that, today,
power more than 20 different commercial and military aircraft types for more
than 600 operators across the globe.
Recently, the
CFM56 fleet established a new world record by becoming the first aircraft
engine family in aviation history to achieve one billion engine flight hours.
US
Aerospace and Defense Industry 2018 Performance 7
The American aerospace and defense
industry’s exports totaled $151 billion in 2018, an increase of 5.81 percent
from the previous year.
A&D exports accounted for 9
percent of U.S. exports in 2018. Furthermore, the industry experienced a $90
billion trade surplus.
The A&D industry also produced
$929 billion in economic output, which contributed more than $374 billion to the
U.S. gross domestic product.
Within the U.S. workforce, the
A&D industry was responsible for 2.5 million jobs, which accounted for 20
percent of manufacturing positions in the U.S.
Interesting
Highlights from the FAA Aerospace Forecast 2019-2039 8
Boeing 2019-2038 Global Pilot and
Technician Outlook9
Civil UAS
Market Tripling in Size by 202810
The annual market for civil
unmanned aerial systems (UAS) is set to almost triple in size from around $5
billion in 2019 to $14.5 billion in 2028, according to a new Teal Group report.
This represents a compound annual
growth rate of 12.5 percent and a total market value of approximately $96.7
billion over the 10-year period.
Major sectors expected to increase
drone use significantly include agriculture, construction, insurance, energy,
communications, and delivery.
2019 EAA
AirVenture Fly-in numbers11
More than 10,000 aircraft
When the fly-in is active, the air
traffic control is the busiest in the world
2,700 show planes
Over 1,000 home-built aircraft
100 Sea planes
FAA air traffic control crews
handled 14,500 aircraft movements through nine days
Cargo
Drones Activity and Forecast12
The global drone logistics and
transportation market generated more than $24 million in revenue in 2018, a
number that’s expected to grow to $1.6 billion in 2027, according to The
Insight Partners. These drones could be the disruption needed in a global supply
chain that’s been fairly stagnant since the 1950s.
IATA
Reveals Airlines Carried 4.4 Billion Passengers in 201813
New research from the
International Air Transport Association revealed that airlines around the world
carried 4.4 billion passengers in 2018, an increase of 6.9 percent from the
previous year.
The IATA also found that
efficiency reached record-breaking numbers, as 81.9 percent of available seats
were filled.
Fuel efficiency also improved by
more than 12 percent when compared to 2010 figures.
Flight availability is also on the
rise, with 22,000 city pairs now connected by direct journeys, an increase of
1,300 over 2017 and double the 10,250 city pairs connected in 1998.
As for the cost of air transport,
it has been cut in half over the last 20 years.
The region that saw the fastest
growth in airline passengers during 2018 was the Asia-Pacific region. In total,
1.6 billion passengers in the region, an increase of 9.2 percent compared to
2017 and representing 37.1 percent of the global market share.
Global ACMI
will reach $7.07B by 202514
ACMI (aircraft, crew, maintenance,
and insurance) or the “wet lease” of an aircraft saw a significant amount of
growth over the last few years, partially due to the ever-increasing demand of
air travelers along with substantial growth in the number of airports paired
with major airlines ready to receive new aircraft.
Aviation’s ACMI global market
revenue is projected to reach over USD 7.07 B by 2025.
Amount of
money left behind at security checkpoints in 201815
$960,105.00 was left at airport
checkpoints in 2018
According to the TSA, the unclaimed
money will be used for training
Airline and Aviation stats regarding going Green16
Worldwide, commercial
aviation is responsible for just 2 percent of global greenhouse gas emissions
The world’s airlines have a
set a goal of reducing net CO2 emissions by 50 percent in 2050 as compared with
2005 levels.
Between 1978 and 2018, the
U.S. airlines improved fuel efficiency by more than 130 percent, saving nearly
5 billion metric tons of CO2. That’s like taking 26 million cars off the road
every year. And speaking of cars, while U.S. carriers account for less than 2
percent of the nation’s greenhouse gas emissions, passenger vehicles account
for more than 17 percent.
Airbus
Forecast Highlights17
The world’s passenger and
freighter aircraft fleet is set to more than double from today’s nearly 23,000
to almost 48,000 aircraft by 2038.
Traffic growing at 4.3%
annually.
Resulting in a need for
550,000 new pilots and 640,000 new technicians.
By 2038, of the forecast
47,680 fleet, 39,210 are new aircraft and 8,470 remain from today.
Over
‘n out
Roy
‘Royboy’ Resto
AimSolutionsConsulting.com
1Educating the Public Helps Bring Laser
Strike Numbers Down; FAA GovDelivery Communication, 4/11/2019
You’re on your honeymoon. Your eyes are a-glaze with thoughts of a tranquil reverie with your beloved. Soon the honeymoon will be over and you’ll come home to the new reality of the challenge to make the relationship work. And so it is with airlines…but how so?
You have a new and young fleet. The aircraft, engines, and components are covered by warranty. Even as those warranties expire, it will be some time before many of those parts reach their forecasted MTBR’s (Mean Time Between Removals). All of this keeps the Maintenance (MX) portion of the airline’s CASM or CASK (Cost per Available Seat Mile or Kilometer) very low. In fact, during an aircraft’s life cycle, the MX costs will never be as low as when it’s first introduced into service. Operators lovingly call this period the ‘honeymoon’. After the honeymoon, MX costs rise as forecast, but:
In this article, Royboy is predicting that certain MX costs are going to rise higher than forecast and therefore constitute an unexpectedly higher percentage of CASM than budgeted for.
Before we go any further, I’m going to ask you to carefully, critically read another article I wrote titled “OEM ANTI-COMPETITIVE, MONOPOLISTIC PRACTICES IN THE AFTERMARKET”. Here’s the link:
Having read that, it’s just a matter of time before the OEMs ‘mitigate’ their aftermarket competition, and guess what happens to pricing when there’s hardly any competition? This is the basis for my prediction; left unchecked, it will happen.
So why currently aren’t the airlines, independent MROs, and distributors who would be victimized raising a cry? There are many reasons, here are some:
The ‘mitigation’ of competition in the aftermarket is occurring very slowly; figuratively speaking, the frog is staying in the increasingly hotter, and about to boil pot, but the frog isn’t jumping.
Fuel prices are still relatively low (now rising) and passengers are flying in record breaking numbers, so the airlines are making money; don’t worry, be happy!
The airlines have learned to rationalize the over-capacity problems of the past. This further enhances profitability and marginalizes sideline issues.
The aforementioned honeymoon effect.
New aircraft have been superbly engineered; parts are staying ‘on-wing’ longer (bigger MTBRs) and scheduled maintenance checks occur at longer intervals. The resulting lower total MX costs may mask the rise in the costs for individual Rotable repair and overhaul.
All this contributes to an atmosphere of ‘irrational exuberance’ which masks and creates a ‘fog of war’. Due to the multitude of dynamic market, MX, and operational factors, is there a way to properly gage the predicted phenomenon? Professor Royboy suggests using the following simple formula:
The formula should be normalized for the following factors:
Use the same period; for example ‘annual’
Exclude parts under factory warranty
Adjust for normal and expected annual economic influences on growth
Derive and include data from PBH agreements
These average costs are the subject of this article.
The formula should be looked upon as a rough order of magnitude, and any significant deviation from your historical levels should trigger further analysis.
But back to the Pachyderm in the Parlor: Is anything being done to address the purported anti-competitive monopolistic practices?
The previously cited article mentioned that the European Commission and IATA were actively looking into allegations of monopolistic anti-competitive behaviors in the aftermarket by OEMs. Since that article, CFM and IATA settled on issues which were hailed as a watershed moment. In that decision, CFM clearly articulated as a matter of policy, that it would accommodate such practices as PMA parts, DER repairs, and access to OEM Manuals1.
It was widely hoped that this would be a herald to other OEMs. But has anything changed?
If you ask independent firms in the aftermarket (who would otherwise compete with OEMs), they’ll give you a resounding no! In other words, many of the OEM practices in the aftermarket cited in my previous article are still widely practiced by many OEMs (not CFM).
CFM claims that although the settlement resulted in stated Corporate Policy, that the issues involved were really already allowed2.
There is talk that IATA issued additional complaints against other OEMs, but as of this writing there have been no public acknowledgements or outcomes.
One of the issues continuing to restrict competition is access to OEM manuals. How can an independent, qualified AMO or Repair Station compete if it is not given access to the OEM’s Maintenance Manuals? Recently the US Federal Trade Commission held a workshop titled “Nixing
the Fix3”. Among the many issues discussed was the FTC’s desire to shed light on the challenges faced by repair stations when trying to obtain Maintenance Manuals. There
are existing regulations whereby the OEMs must make available these manuals to
qualified MROs, but there is wide consensus that since there is no enforcement,
many OEMs continue to restrict access. In the USA, that enforcement must come from the FAA. I support and have a great deal of respect for the FAA and their leadership, but I just can’t understand why this issue does not get enforcement support.
To be clear, there are many OEMs who are not engaging in the sort of behaviors discussed, but unfortunately there are enough major OEMs who are, and they are setting the precedents for others to follow if the behaviors remain unchecked.
Your comments or counterpoints are welcomed in the comments section at the end of this article.
To lawyers and quality geeks, the careful selection of words
one uses to communicate is a source of constant musing. Because of this I’m amazed
that preflight passenger briefings continue to use a curious mixture of
potentially confusing words for the inexperienced passenger. For example, “posted
placards”. Huh? What’s a placard? Also,
“no congregating around the forward lavatory”. Congregating? Are they
expressing a religious restriction? I’m offended. Why not just plainly call a
placard- signs, or for congregating- assembling or flocking or massing…so my
thesaurus says.
Thankfully for those in the global aviation community, use
of the term Safety Management System or SMS evokes no such ambiguity or
confusion.
I recently had a pleasurable experience assisting a firm in
Brasil implement a SMS for their Repair Station. In Europe and in Canada too, the
applicable civil aviation authorities are mandating SMS systems for Maintenance
Organisations. Indeed, it is being mandated by Civil Aviation Authorities
globally for Maintenance Organisations…except in the USA.
Before anyone wags their finger at me, I must point out that
air carriers in the USA have indeed been
required to implement SMS’s. For example, this FAR:
“5.1:
Applicability. (a) A certificate holder under part 119 of this chapter
authorized to conduct operations in accordance with the requirements of part
121 of this chapter must have a Safety Management System that meets the
requirements of this part and is acceptable to the Administrator by March 9,
2018”
While US 121’s are in sync with global SMS trends, this is not so with US 145’s; there is
no such requirement for Repair Stations.
So what is a SMS? According to the definition in this FAR:
“5.5:
Safety Management System (SMS) means the formal, top-down, organization-wide
approach to managing safety risk and assuring the effectiveness of safety risk
controls. It includes systematic procedures, practices, and policies for the
management of safety risk.”
The purpose of this article is not to introduce you to SMS
principles which are profound, but to focus on the issue that USA 145s are not currently
required to implement these systems.
Global voices and various alphabet groups have a way of
influencing perceived imbalances. Let’s look at some interesting issues to
illustrate my point.
During the heyday of US labor groups bemoaning the
profligate outsourcing of maintenance work to firms outside the USA, it was
common to hear in the halls of Congress, complaints by those labor groups that
it was unfair and unsafe for US maintenance organizations to compete against foreign
maintenance organisations because those foreign firms were not required to have
drug and alcohol testing programs as modeled by US firms.
What if:
What if those foreign maintenance firms today said that it
was unfair and unsafe to compete against US 145 maintenance organizations
because they’re not required to implement SMS as is modeled by the rest of the
world? After all, implementing a SMS is not cheap. Hmmm…
Further stirring the pot; another idea to dwell upon: Many
years ago the FAA gave the industry the expectation that when part 21 was re-written,
it would mandate Production Approval Holding (PAH) manufacturers to issue
8130-3 tags as is generally required and practiced by other Civil Aviation
Authorities around the world. For example Form 1’s. Along came the FAR 21 rewrite
sans
the 8130-3 requirement.
Roll forward several years and along came the now famous
“EASA MAG” requirement imposing upon US, EASA Approved
Repair Stations the requirement to have 8130-3 tags on parts from those PAHs,
even though the FAA had not facilitated that process. Wow, that was an interesting way
to make the US harmonize with what the rest of the world was doing.
So, you may ask, why the sudden renewed interest in SMS?
EASA has issued a Notice of Proposed Amendment (NPA) that
would update or establish new SMS regulations for repair stations and
manufacturers1, 2, 3.
Let’s connect the dots. According to a recent article3:
“Once
the regulations go into force, existing EASA 145 organizations will have two
years to modify their systems in order to comply with the new regulations.This will likely have delayed effect on
US-based EASA 145 organizations, because those organizations are required to
comply with US regulations and the additional special conditions (as described
in the Maintenance Annex, and also consistent with the implementation guidance
in the Maintenance Annex Guidance); but the change in the EASA regulations
could lead to a subsequent change in the special conditions.”
Clearly
then, there is the possibility that
SMS may trickle down to USA EASA Approved Repair Stations through the
instrumentality of the Maintenance Annex Guidance (MAG), in much the same way 8130-3’s
for PAH’s did. To be clear, if this occurred it would only affect US EASA
Approved Repair Stations.
On the
other hand, the FAA has not been idle
regarding the idea of SMS for Repair Stations and in fact has been active with
other global groups such as the Safety Management International Collaboration
Group. At this moment the FAA has been working with a few US Repair Stations
who are voluntarily implementing SMS and testing the waters on how recognition
could be given to such firms.
Is implementation of SMS systems
for Repair Stations a bad thing?
Devotees
of safety and quality will no doubt quickly respond in the positive; it’s a good thing. In the past,
regarding the 8130-3’s for PAH’s, we heard that the reason for not doing so in
the Part 21 rewrite was because many manufacturers said it would cost too much.
There is the possibility that in the US, the lack of a regulation to implement
SMS for part 145 Repair Stations has a similar basis. Thankfully, nearly all
guidance on implementing SMS for Repair Stations is based on the size of the firm,
so small repair stations won’t have to implement the same amount of processes
and procedures as would large firms. For example, see “SMS Systems for Small
Organizations4”.
Finally,
for US Repair Stations which are ISO/AS accredited such as 9001, 9100, and 9110,
you will immediately take notice of a significant feature of SMS which is Risk
identification, management, and mitigation. Royboy would advise you cross
reference your ISO/AS P&P’s to the SMS P&P’s to avoid duplication and bring
a degree of harmony to both systems.
PS:
Back to our sidebar about in-flight announcements. I often wonder if pilots,
upon passing their union probation, are required to sign an agreement in which
passengers will be referred to as “Folks”? This is mainly a US phenomenon.
So…all the placards seem to indicate that the world is
congregating around the idea of SMS systems for everyone. That’s all folks.
As promised,
here is part I of 2019’s compilation of Facts, Figures, and Forecasts (F3).
I normally would have posted this later this year, but there was a considerable
abundance of data, so here ‘tis. By the way many of you have shared your like
for this information, so I’ll keep gathering it for periodic postings.
The source
citations are at the very end.
Here are the
data listings, in this order:
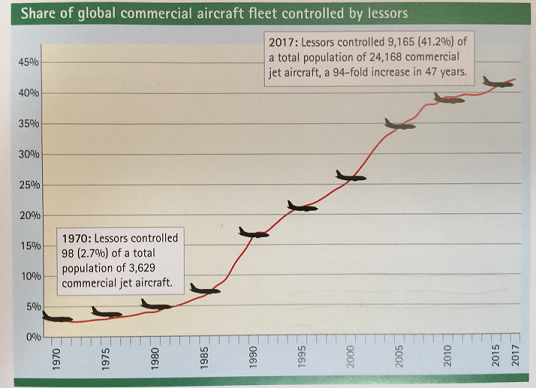
Share of Global Commercial Aircraft
Fleet Controlled by Lessors
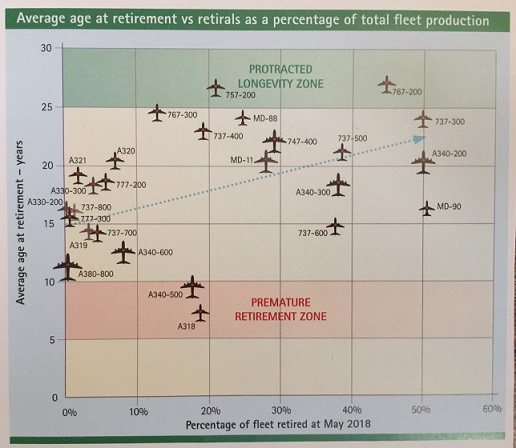
Average Age at Retirement vs. Retirals
as a Percentage of Total Fleet Production
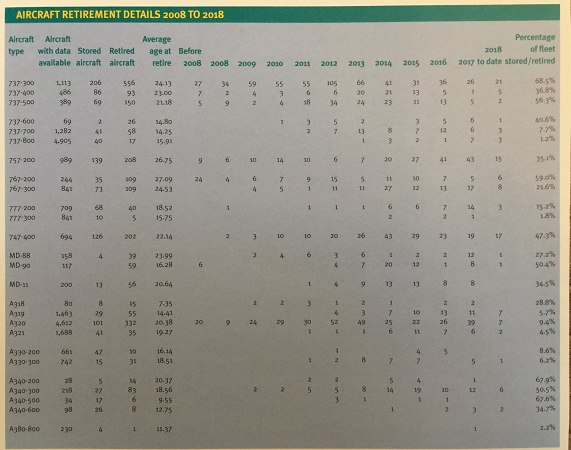
Aircraft Retirement Details 2008-2018
Incidents on board becoming more
common & more serious
Aviation death rate climbs to 500 in
2018
Boeing forecasts demand for 2,300 new
airplanes in India
US Aviation Technician Stats and
Education Progress
Embraer presents preliminary forecast
for 2019 and 2020
Freighter aircraft growth and conversions
Healthy growth and record passenger
loads boosted airlines in 2018
Embraer 2018 Deliveries
2018 Avionics Sales Reached a Record
$2.7B
Honeywell Forecasts 4,000 New Civil
Helicopter Deliveries Over Next Five Years
Police use of Drones
Airbus and Boeing Supplier numbers
Fighters/Attack Aircraft Market Share
2019-2023
Military Transport Market Share
2019-2023
Business Aircraft Market Share
2019-2023
Commercial Aircraft Market Share
2019-2023
Airframe Heavy Maintenance Demand by
Region 2019-2028
A
A
A
Incidents on board becoming more common & more
serious1
Unruly passenger incidents are not
only increasing, but also becoming more serious, IATA warns. In 2017, one
incident was reported every 1,053 flights, while a year earlier one incidents
was reported per 1,424 flights.
In addition to becoming more frequent,
incidents are also becoming more serious. In a year to 2017, level 3 and 4
incidents were reported four times more often (4% versus 1% in 2016). Level 3
refers to life threatening behaviors, while level 4 – attempted or actual
breach of flight deck security. However, when a drunk passenger falls onto
cockpit door, this could also be classified as level 4 incident.
Royboy: What? Alcohol involved in the
incidents? No way….
Aviation death rate climbs to 500 in 20182
The year 2018 demonstrated a worse
aviation safety performance than 2017, with 32 accidents and 301 fatalities on
board recorded in the first half of the year – thus, excluding Lion Air crash.
According to Meyer (IATA), another six incidents and 216 deaths happened in the
second part of the year, putting the death toll at around 500 in 2018.
Nevertheless, it is still a huge
safety improvement when compared with 10 years ago. The accident rate increased
in half of IATA regions, however, Africa and CIS countries stand out the most.
Despite the fact that accident rate in these two regions are falling the most,
they still remain well above world average.
Boeing forecasts demand for 2,300 new airplanes in
India3
Boeing has
raised its long-term forecast for commercial airplanes in India as
unprecedented domestic passenger traffic and rapidly expanding low-cost
carriers (LCCs) drive the need for 2,300 new jets – valued at US$320 billion –
over the next 20 years.
US Aviation Maintenance Technician Stats and Education
Progress4
The majority of maintenance technician
schools reporting anticipate the number of 2018 graduates will increase 10%
over 2017, and a further 11% in 2019. And they expect total enrollment to
increase 40% in 2019.
Furthermore, school capacity is no
hurdle. Only one half of the seats in technical schools are now taken, so an
additional 17,000 students can be readily accommodated.
One problem has been that a
substantial portion of aviation technician school graduates has been seeking
non-aviation jobs. The latest report says the number seeking non-aviation jobs
has now dropped by nearly half, to 13%. And 70% of students are now taking the
FAA mechanic exam upon graduation, a 10-point increase over the previous two
years.
Of 6,401 mechanics certificated in
2017, 63% obtained certification based on completion of a technician school
program, 10% based on military experience and 27% based on civilian experience.
The FAA now counts 293,000
certificated mechanics, of which females make up 2.4%, a portion that has been
constant for 15 years.
30% of mechanics are now 60 years of
age or older, which is a 3% increase from the prior year. And new mechanics
still account for only 2% of the workforce each year. Unless this rate of
replacement is increased, the mechanic population will decline 5% over the next
15 years, the Council projects.
Embraer presents preliminary forecast for 2019 and
20205
For 2019, Embraer expects to deliver
between 85 and 95 commercial jets, 90 to 110 executive jets, including light
and large jets, 10 A-29 Super Tucano aircraft and two multi-mission KC-390
aircraft.
Freighter aircraft growth and conversions6
With air cargo traffic more than
doubling in the next 20 years, the Boeing analysis shows that world freighter
fleet will grow by more than 70%, from the current 1,870 to 3,260 aircraft.
More than 63% of deliveries will be freighter conversions, of which nearly 70%
will be standard-body passenger types. Also, growing demand for regional express
services in fast developing economies will boost the standardbody share of the
freighter fleet from 37% today to 39%.
Healthy growth and record passenger loads boosted
airlines in 20187
Global passenger traffic growth in
2018 rose by an above-average 6.5 percent compared to the previous year as
airlines transported more than 4.3 billion passengers and planes were fuller
than ever.
International passenger traffic in
2018 climbed 6.3 percent, down from 8.6 percent the previous year. Capacity
rose 5.7 percent and the load factor increased 0.4 percentage points to 81.2
percent.
IATA said all regions recorded
increases in traffic, led by the Asia-Pacific (up 7.3 percent), but only North
America (up 5 percent) and Africa (up 6.5 percent) did better than the previous
year.
Middle East carriers (4.2
percent)saw a second year of moderating
demand growth and the load factor slipped 0.7 percentage points 74.7 percent,
reflecting policy measures and geopolitical tensions.Traffic actually declined 0.1 percent in December,
but IATA said this may reflect data volatility.
Traffic at Latin American airlines
rose 6.9 percent, down from 8.8 percent annual growth in 2017 as strikes in
Brazil and geopolitical factors came into play.
Global domestic air travel climbed 7
percent in 2018 with all markets showing annual growth, led by double-digit
increases in India and China. The load factor increasing marginally to 83
percent.
Embraer 2018 Deliveries8
Embraer has delivered a total of 181
jets in 2018, of which 90 were commercial aircraft and 91 were executive jets
(64 light and 27 large).
2018 Avionics Sales Reached a Record $2.7B9
Worldwide business and general
aviation avionics sales increased 17 percent year-over-year in 2018, reaching a
record $2.7 billion, according to the Aircraft Electronics Association’s
year-end Avionics Market Report released yesterday. This total, which was up
from
$2.3 billion in 2017, includes some $1.5
billion in retrofit sales and more than $1.1 billion in forward-fit sales
(avionics equipment installed by airframe manufacturers during original
production), the report said.
Honeywell Forecasts 4,000 New Civil Helicopter
Deliveries Over Next Five Years10
Honeywell forecasts 4,000 new
civilian-use helicopters will be delivered from 2019 to 2023, marginally lower
than the 4,200 cited in the five-year forecast from 2018.
Purchase plans are stronger from law
enforcement and oil and gas operators in this year's survey, but significantly
lower from corporate operators.
A greater proportion of planned new
helicopter purchases are for intermediate/medium twin-engine models in this
year's survey compared with 2018. The proportion is lower for light
twin-engine. The proportion of light single-engine and heavy twin-engine
planned purchases are about the same as last year.
When choosing make and model for a new
aircraft, the top three factors operators consider are brand experience,
aircraft performance and cabin size.
Police Use of Drones11
A new report by the Center for the
Study of the Drone at Bard College found that 910 state and local
first-responder agencies have bought drones in recent years, two-thirds of them
law enforcement.
Agencies in 619 counties in every
state except Rhode Island now have drones, and many have multiple agencies with
the technology. Primarily, they are being used to find people who need help in
locations traditionally difficult for humans to navigate with conventional
vehicles.
The Bard study found most agencies
with drones did not previously have aerial capability, and 80 percent of those
that do now also fly a manned aircraft.
Airbus and Boeing Supplier numbers12
Boeing takes in more than a billion
parts a year from its supply chain. This equates to $60 Billion a year for its
13,000 suppliers worldwide including 58 countries.
Airbus counts 12,000 suppliers from
more than 100 countries.
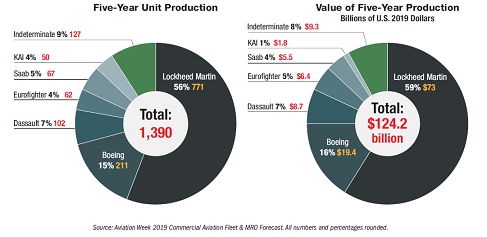
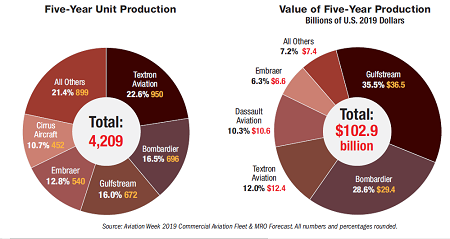
Fighters/Attack Aircraft Market Share 2019-202313
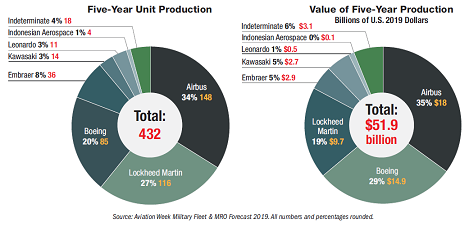
Military Transport Market Share 2019-202313
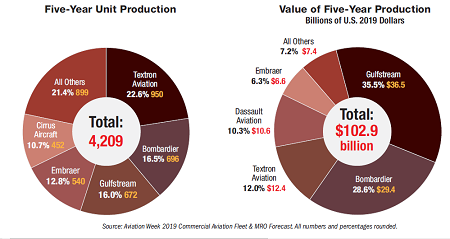
Business Aircraft Market Share 2019-202313
Commercial Aircraft Market Share 2019-202313
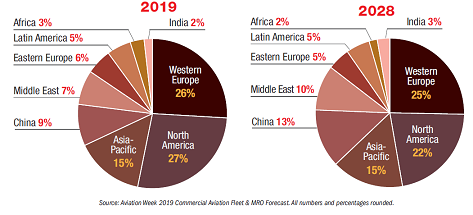
Airframe Heavy Maintenance Demand by Region 2019-202813
I detect that I have set a new personal record (woohoo!) for
the amount of acronyms in a blog article title at four. If you’re reading this,
you probably already have a good handle on what they mean, but more on that
later.
Before we get started I wanted to make a suggestion to those
of you who are responsible for maintaining those pesky Approved Supplier Lists
required by nearly all quality standards. Many of you give automatic approval
to firms who are accredited, for example, to the ASA-100, and are shown on the
FAA’s listing of AC 00-56 accredited distributors. For firms who are accredited
disassemblers and recyclers, the listing of such firms is maintained by the Aircraft
Fleet and Recycling Association (AFRA) on the Directory Tab of their https://afraassociation.org/ website. For
AFRA accredited listed firms, you too can also give them automatic approval for
those services. Royboy’s counsel: As with
the ASA-100, don’t confuse membership with accreditation. Although membership
is always encouraged, membership alone does not guarantee a bona fide quality
system.
A PRIMER:
Many years ago, with the forecasted accelerating growth of
aircraft retirements, the industry recognized a need to retire and recycle aircraft
in an orderly and uniform manor. AFRA, the Aircraft Fleet and Recycling
Association (AFRA) stepped up and worked with many industry leaders to develop
the Best Management Practices (BMP) for Disassembling and Recycling Aircraft.
The BMP was and remains the basis for establishing a quality system to perform
this work. It is also the basis for accreditation. Firms who demonstrably
implement and uphold the BMP are audited, and upon passing are placed on AFRA’s
list as previously mentioned. The BMP has been continuously updated by AFRA
committees.
ASA and AFRA
All of you who attend the ASA conference will notice that
the ASA and AFRA hold their conferences jointly. This is not coincidental. The
members of each organization actually conduct a good deal of business with each
other, and it is not unusual to find firms holding dual memberships and/or
accreditations in each association.
IATA:
First, a little bit about IATA. From their website at
www.iata.org:
“The International Air Transport Association (IATA) is the
trade association for the world’s airlines, representing some 290 airlines or
82% of total air traffic. We support many areas of aviation activity and help
formulate industry policy on critical aviation issues.”
That is really an
understatement. For all of us that fly, IATA has been a globally accepted influencer
and facilitator for airline business. For example, they have established
standards and guidance for Baggage handling and ID, addressing tariffs, Airline
coding, scheduling, ticketing and reservations, security, loading, fuels,
costing, dangerous goods, finance, accounting, and leasing among many others. IATA’s
stated mission is to represent, lead, and serve the airline industry. IATA has
been presenting regularly at the ASA/AFRA conference and they always provide
valuable global industry insight.
IATA’s BIPAD:
At 101 pages, IATA’s BIPAD document, Best Industry Practices
for Aircraft Decommissioning, is rich in guidance aimed at aircraft owners or
operators regarding business processes and operational experience from best
practices in the industry. On the other hand, AFRA’s BMP is primarily aimed at
firms actually performing aircraft disassembly and recycling. From my analysis,
I concluded that the two documents are complementary, and in fact the BIPAD
cites the AFRA BMP frequently. I like the BIPAD because for anyone contemplating
an active entry into the disassembly and recycling market, the BIPAD provides
additional data and guidance which could establish the basis for a business
plan. There are some interesting and indeed welcomed sections of the BIPAD that
I like. For example:
Appendix B contains “Examples of dangerous and hazardous
materials to be removed and treated from aircraft”. This is welcome since
currently there does not appear to be any other such listing, and the industry
needs awareness and certainly training on the issue.
Insightful
case studies regarding potential value and the market for removed parts.
Useful economic overviews.
Chapter 2 titled “Decision to Decommission” is richly
insightful and informative for operators regarding the decision process,
possible outcomes, and issues to be aware of. It includes such nuggets as
Accounting Principles, Aircraft Value Concepts, and Regulatory and Legal
Aspects.
Chapter 3 contains specific suggestions regarding topics
which employees involved in this activity should be trained on.
ICAO’s influence.
Like IATA, the International Civil Aviation Organisation has,
and continues to exert a great influence on existing and emerging global aviation
regulations and procedures. The BIPAD acknowledges this with the following:
“The International Civil Aviation Organization (ICAO)
supports activities related to aircraft end-of-life and recycling. At its 39th
Assembly in 2016, States were requested to: “consider policies to encourage
the introduction of more fuel-efficient aircraft in the market, and work
together through ICAO to exchange information and develop guidance for best
practices on aircraft end-of-life such as through aircraft recycling” 9.
ICAO has signed a Memorandum of Understanding (MoU) with the
Aircraft Fleet Recycling Association (AFRA) to enhance cooperation and
development of best practices for the management of aircraft end-of-life
processing 10.
In its Environmental Report 2016, ICAO has further
reiterated the need for aircraft life cycle assessments which includes a report
of best practices implemented by AFRA and Bombardier in managing an aircraft’s
end-of-life 11.”
It should be clear that ICAO, IATA, and AFRA are harmonized in
their support of orderly and standardized aircraft retirement practices as
embodied in the BMP and BIPAD.
By the way, for those you wishing that someday there would
be a single set of globally accepted regulations, it will likely come from IATA
and/or ICAO. Imagine, a Repair Station/AMO who only needs a single 145 approval
rather than ten to do business internationally. Just sayin…
As promised, here is part II of 2018’s compilation of Facts,
Figures, and Forecasts (F3). The source citations are at the very
end.
Here are the data listings in this order:
Here’s a listing of the world’s
top defense contractors
Level of Chinese aviation
expansion revealed by CAAC statistics
Number of successful ejections
equating to lives saved by Martin Baker Ejection Seats
Total MRO demand for ATA chapter
25 is $3.7 Billion for 2018 and 2019
Boeing: 128,500 pilots to be
needed in China by 2037
IATA: First time ever passenger
numbers exceed 4 billion
ICAO releases 2018 safety report
Boeing forecasts air cargo traffic
to double in 20 years
The future of low cost
Lasers being pointed at aircraft
Air transport supports 65.5
million jobs and $2.7 trillion in economic activity
Airbus: China will need more than
7,400 new aircraft in the next 20 years
India: new airport and travel
activity
General Aviation Aircraft
manufacturing outlook positive for 2019
Airbus: Fleet in Russia and CIS to
double by 2037
Facts about the FAA and Air
Traffic Control
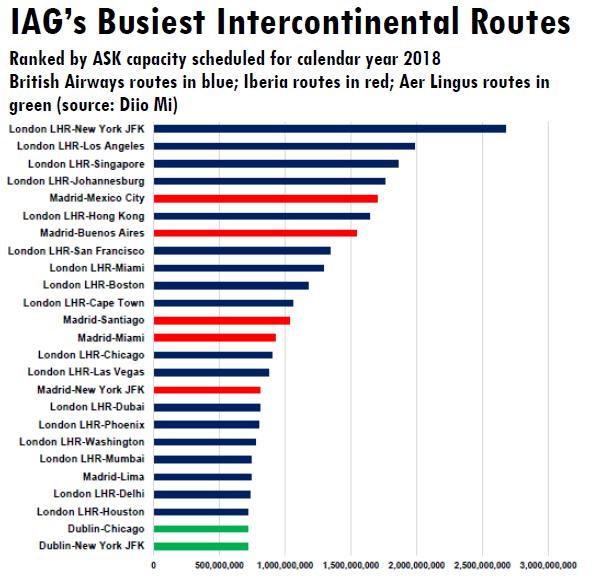
IAG’s Busiest Intercontinental
Routes
Global survey reveals anticipated
significant growth in aviation jobs
And you though your travel budget
was high?
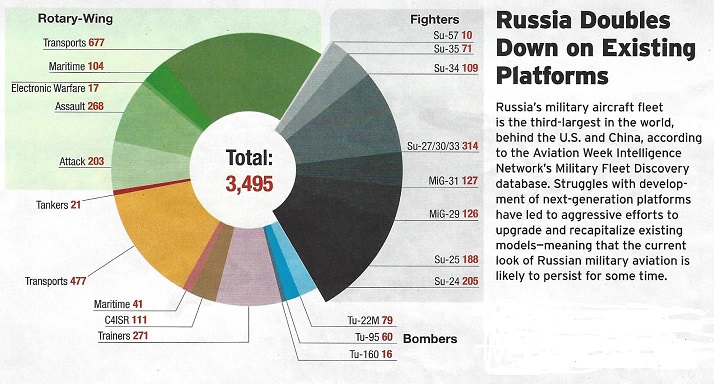
Russian Military Aircraft Fleet
New Entrants for Electric
Propulsion
How Large is the Global Aerospace
Industry?
Africa becoming new opportunity
continent for emerging airlines
NATO Aircraft Distribution
Here’s a
listing of the world’s top defense contractors1:
Rank
Company
Country
2017 Defense
Revenue* (in millions)
Revenue From
Defense
1
Lockheed Martin 1
U.S.
$47,985.00
94%
2
Raytheon Company 1
U.S.
$23,573.64
93%
3
BAE Systems
U.K.
$22,380.04
88%
4
Northrop Grumman 2
U.S.
$21,700.00
84%
5
Boeing 3
U.S.
$20,561.00
22%
6
General Dynamics 4
U.S.
$19,587.00
63%
7
Airbus
Netherlands/France
$11,185.91
15%
8
Almaz-Antey 5
Russia
$9,125.02
100%
9
Thales
France
$8,926.13
50%
10
Leonardo
Italy
$8,856.48
68%
11
United Technologies
U.S.
$7,826.00
13%
12
L3 Technologies
U.S.
$7,749.00
81%
13
Huntington Ingalls Industries
U.S.
$7,030.00
95%
14
United Aircraft Corp. 7
Russia
$6,197.25
80%
15
Leidos
U.S.
$5,218.00
51%
16
Rolls-Royce
U.K.
$4,625.73
16%
17
Booz Allen Hamilton
U.S.
$4,320.00
70%
18
Naval Group
France
$4,178.33
100%
19
Harris Corporation
U.S.
$4,158.00
70%
20
Textron Inc.
U.S.
$4,117.42
29%
Level of
Chinese aviation expansion revealed by CAAC statistics2
According to the Civil Aviation
Administration of China (CAAC), 93 new general aviation airports were licensed
in the first half of 2018, more than doubling the number of general aviation
airports in the country. China now has 231 civil airports in a total of 404
airports which support the take-off and landing of general aviation aircraft.
118 new general aviation aircraft
were registered with the CAAC in the first half of the year, bringing the
country’s total to 2,415 with a 9.5-percent year-on-year increase.
Currently, China has direct air
routes with 45 countries alongside the Belt and Road, operating roughly 5,100
flights per week. CAAC has also signed documents with the Czech Republic,
Kazakhstan, New Zealand and Australia to secure civil aviation cooperation.
Number of
successful ejections equating to lives saved by Martin Baker Ejection Seats3
7,580
Total MRO
demand for ATA chapter 25 is $3.7 Billion for 2018 and 20194
Over the next two years,
commercial, regional and business aircraft will go through $3,700,958,983 worth
of total MRO demand.
ATA chapter 25 is comprised of :
Flight Compartment, Passenger Compartment, Buffet/Galley, Lavatories, Cargo
Compartments, Emergency, Accessory Compartments, Power Drive Units, Coffee
Makers, Water Heaters, Boilers, Etc.
Boeing:
128,500 pilots to be needed in China by 20375
Boeing reports that the Asia
Pacific region will have the greatest global demand for new civil aviation
personnel over the next 20 years. The region is projected to account for 33
percent of the global need for pilots, 34 percent for technicians and 36
percent for cabin crew.
Forty percent of all new passenger
airplane deliveries in the next 20 years will be delivered to airlines in the
Asia Pacific, also making the region leading in personnel demand, according to
2018 Boeing Pilot & Technician Outlook - an industry forecast, tied to
projections for new airplane deliveries.
New commercial technician demand
decreased five percent to 242,000. This is due to advancements in product
development on the 737 MAX, which have resulted in increased maintenance
efficiencies. Overall, maintenance hours required over the life of the airplane
will be reduced.
New commercial cabin crew demand
increased three percent to 317,000 due to anticipated fleet mix, cabin
configuration and regulatory requirements.
Including the demand in the
helicopter and business aviation markets, 261,000 pilots, 257,000 technicians
and 321,000 cabin crew will be needed in the region.
Leading the region in projected
demand for new pilots, technicians and cabin crew:
South Asia: 42,750 pilots; 35,000
technicians; 43,250 cabin crew
IATA: First time ever passenger
numbers exceed 4 billion6
Worldwide annual air
passenger numbers exceeded four billion for the first time in 2017, the
International Air Transport Association (IATA) announced on September 6, 2018.
In its industry performance statistics for 2017, the association also observes
that airlines connected a record number of cities worldwide, providing regular
services to over 20,000 city pairs in 2017, more than double the level of 1995.
The unprecedented
passenger numbers growth is supported by a broad-based improvement in global
economic conditions and lower average airfares, according to IATA. “In 2000,
the average citizen flew just once every 43 months. In 2017, the figure was
once every 22 months,” said Alexandre de Juniac, IATA’s Director General and
CEO.
The association also
provides the following data of the 2017 airline industry performance:
Passenger
System-wide,
airlines carried 4.1 billion passengers on scheduled services, an increase of
7.3% over 2016, representing an additional 280 million trips by air.
Airlines
in the Asia-Pacific region once again carried the largest number of passengers.
The regional rankings (based on total passengers carried on scheduled services
by airlines registered in that region) are:
1. Asia-Pacific 36.3% market share (1.5 billion passengers, an increase of
10.6% compared to the region’s passengers in 2016)
2. Europe 26.3% market share (1.1 billion passengers, up 8.2% over
2016)
3. North America 23% market share (941.8 million, up 3.2% over 2016)
4. Latin America 7% market share (286.1 million, up 4.1% over 2016)
5. Middle East 5.3% market share (216.1 million, an increase of 4.6% over
2016)
6. Africa 2.2% market share (88.5 million, up 6.6% over 2016).
The
top five airlines ranked by total scheduled passenger kilometers flown, were:
1. American
Airlines (324 million)
2. Delta Air Lines (316.3 million)
3. United Airlines (311 million)
4. Emirates Airline (289 million)
5. Southwest Airlines (207.7 million)
The
top five international/regional passenger airport-pairs** were all within the
Asia-Pacific region, again this year:
1. Hong Kong-Taipei Taoyuan
(5.4 million, up 1.8% from 2016)
2. Jakarta Soekarno-Hatta-Singapore (3.3 million, up 0.8% from 2016)
3. Bangkok Suvarnabhumi-Hong Kong (3.1 million, increase of 3.5% from
2016)
4. Kuala Lumpur–Singapore (2.8 million, down. 0.3% from 2016)
5. Hong Kong-Seoul Incheon (2.7 million, down 2.2% from 2016)
The
top five domestic passenger airport-pairs** were also all in the Asia-Pacific
region:
1. Jeju-Seoul Gimpo (13.5
million, up 14.8% over 2016)
2. Melbourne Tullamarine-Sydney (7.8 million, up 0.4% from 2016)
3. Fukuoka-Tokyo Haneda (7.6 million, an increase of 6.1% from
2016)
4. Sapporo-Tokyo Haneda (7.4 million, up 4.6% from 2016)
5. Beijing Capital-Shanghai Hongqiao (6.4 million, up 1.9% from 2016)
One
of the interesting recent additions to the WATS report is the ranking of
passenger traffic by nationality, for international and domestic travel.
(Nationality refers to the passenger’s citizenship as opposed to the country of
residence.)
1. United States of America
(632 million, representing 18.6% of all passengers)
2. People’s Republic of China (555 million or 16.3% of all
passengers)
3. India (161.5 million or 4.7% of all passengers)
4. United Kingdom (147 million or 4.3% of all passengers)
5. Germany (114.4 million or 3.4% of all passengers)
Cargo
Globally,
cargo markets showed a 9.9% expansion in freight and mail tonne kilometers
(FTKs). This outstripped a capacity increase of 5.3% increasing freight load
factor by 2.1%.
The
top five airlines ranked by scheduled freight tonne kilometers flown were:
1. Federal Express (16.9 billion)
2. Emirates (12.7 billion)
3. United Parcel Service (11.9 billion)
4. Qatar Airways (11 billion)
5. Cathay Pacific Airways (10.8 billion)
Airline
Alliances
Star Alliance
maintained its position as the largest airline alliance in 2017 with 22%
of total scheduled traffic (in RPKs), followed by SkyTeam (19%) and oneworld
(16%).
ICAO releases 2018 safety report7
The
International Civil Aviation Organization (ICAO) observes a general trend of
lower number of fatal accidents and fatalities over the past ten years,
according to the findings in its 2018 edition of its Safety Report, released
this week.
The report summarizes the organizations safety
initiatives in 2017 and provides safety performance indicators in 2013–2017.
In 2017,
there were 4.1 billion passengers travelling by air worldwide on scheduled
commercial services, the organization summarized in a statement released on
September 5, 2018. ICAO accounts 5 fatal accidents and 50 passenger deaths in
2017, putting the commercial aviation safety rate at 12.2 fatalities per
billion passengers and confirming its previous proclaim that 2017 was the
safest year on the record in aviation history.
ICAO claims it remains “particularly focused on its
safety priorities”, including Runway Safety, Controlled Flight into Terrain
(CFIT), Loss of Control Inflight (LOCI), and new safety initiatives. In 2018
report, it notes that global average of effective implementation of ICAO
Standards and Recommended Practices increased from 64.7 % in 2016 to 65.5% in
2017.69.19 % of 192 member states have
achieved the 60 % target, set by the Global Aviation Safety Plan (GASP)
2017–2019 edition.
Boeing
forecasts air cargo traffic to double in 20 years8
Boeing projects air cargo
operators will need more than 2,600 freighters over the next two decades to
keep up with increasing global freight traffic, which is expected to double
with 4.2 percent growth annually.
The 980 new medium and large freighters
and 1,670 converted freighters will go toward replacing older airplanes and
growing the global fleet to meet demand, according to the new World Air Cargo
Forecast, released by Boeing today at The International Air Cargo Association's
Air Cargo Forum and Exhibition.
Some of the factors driving the
growth in air cargo include a growing express market in China and the global
rise of e-commerce, which is forecast to increase 20 percent annually to nearly
$5 trillion in 2021 according to Boeing's analysis.
To meet growing market needs, Boeing also forecasts:
The world freighter fleet will
expand by more than 70 percent, from the current total of 1,870 to 3,260
airplanes.
Demand for regional express
services in fast-developing economies will boost the standard-body share of the
freighter fleet from 37 percent today to 39 percent.
1,170 standard body and 500 medium
wide-body passenger airplanes will be converted into freighters over the next
two decades.
The future
of low cost9 (Article excerpts regarding Low Cost Carriers, LLC’s)
Today, half a century later, low
cost has become the preferred means of travel for a third of the world's
passengers. It is estimated that in 2027 - that is, within ten years - half of
the nearly 7 billion flights globally will be of this type.
The consultant OAG estimates that
this year more than 50 percent of travelers from 10 European countries are
already choosing low-cost airlines. Macedonia tops this list; however, the
country that offers most low-cost seats is Spain, with 82.2 million last year.
Meanwhile, Irish airline Ryanair is a leading low cost carrier, but due its
labor problems this year, it can be overtaken by Easyjet. The low cost model
has provided the means of travel to many people, who were previously unable to
do it.
Another rising phenomenon is the
so-called low-cost, long-range (low-cost long-haul) – a bet, already taken by
Norwegian. 20% of its fleet is currently devoted to such flights, and the
airline is already expanding, by adding subsidiary in Argentina or opening new
transoceanic routes like the one planned between London and Rio de Janeiro.
Lasers being pointed at aircraft10
Laser strikes on aircraft and
helicopters have risen over the years and laser pointers are increasing in
power and decreasing in price. Lasers can distract and even harm pilots during
critical phases of flight and can cause temporary visual impairment. Over 6750
laser incidents were recorded in the USA in 2017 according to the Federal
Aviation Administration. In 2016 there were over 1750 laser incidents reported
to the UK Civil Aviation Authority and Transport Canada Civil Aviation.
Air
transport supports 65.5 million jobs and $2.7 trillion in economic activity11
The global air transport sector
supports 65.5 million jobs and $2.7 trillion in global economic activity,
according to new research released today by the Air Transport Action Group
(ATAG).
"There are over 10 million
women and men working within the industry to make sure 120,000 flights and 12
million passengers a day are guided safely through their journeys. The wider
supply chain, flow-on impacts and jobs in tourism made possible by air transport
show that at least 65.5 million jobs and 3.6% of global economic activity are
supported by our industry."
Key facts outlined in Aviation: Benefits Beyond Borders,
include:
-Air transport supports 65.5
million jobs and $2.7 trillion in global economic activity.
-Over 10 million people work
directly for the industry itself.
-Air travel carries 35% of world
trade by value ($6.0 trillion worth in 2017), but less than 1% by volume (62
million tonnes in 2017).
-Airfares today are around 90%
lower than the same journey would have cost in 1950 – this has enabled access
to air travel by greater sections of the population.
-If aviation was a country, it
would have the 20th largest economy in the world – around the same size as
Switzerland or Argentina.
-Aviation jobs are, on average,
4.4 times more productive than other jobs in the economy.
-Scope of the industry: 1,303
airlines fly 31,717 aircraft on 45,091 routes between 3,759 airports in
airspace managed by 170 air navigation service providers.
-57% of world tourists travel to
their destinations by air.
Airbus:
China will need more than 7,400 new aircraft in the next 20 years12
China will need over 7,400 new
passenger aircraft and freighters from 2018 to 2037, with a total market value
of US $1,060 billion, according to Airbus’ latest China Market Forecast. It
represents more than 19% of the world total demand for over 37,400 new aircraft
in the next 20 years.
India: new
airport and travel activity13
Kishangarh is one of 34 airports
opened in the past 18 months in India, whose aviation sector has exploded in
the wake of massive economic growth. In September, the civil aviation minister
said that $60 billion has been budgeted for 100 more in the next 10 to 15
years.
By 2024, the IATA estimates, India
will rank behind only China and the United States in terms of air traffic to,
from and within the country.
General
Aviation Aircraft manufacturing outlook positive for 201914
The General Aviation Manufacturers Association expressed
optimism about the industry’s prospects for 2019.
The piston rotorcraft delivery
number of 220 units headlined the year-to-date figures, and marked a
15.8-percent increase from 2017’s third-quarter figure of 190 units delivered.
Turbine rotorcraft shipments accelerated by 8.3 percent, from 471 units
delivered to 510.
The 784 piston airplanes
deliveries marked an improvement over the comparable 2017 period’s tally of
724, for a gain of 8.3 percent. Turboprop airplane shipments came in at 395 for
a 5.6-percent increase over the 374 deliveries of the first three quarters of
2017.
Business jet shipments increased
from 433 to 446, or 3 percent, not far off last year’s totals through three
quarters.
Looking at selected manufacturers
and results reported by GAMA, Cirrus Aircraft shipped 106 airplanes in the
third quarter consisting of 90 singles and 16 SF50 Vision jets. Cirrus’s total
shipments for the year to date added up to 303 aircraft.
Diamond Aircraft had its best
quarter of the year in terms of shipments with 14 twin-engine DA–42 and 15
DA–62 models accounting for 76 percent of the quarter’s total.
Brazilian manufacturer Embraer
shipped 15 Phenom 300 10-seat jets during the quarter; the aircraft has been
noted as an emerging sector leader and has accounted for 24 of the company’s 55
overall aircraft shipments year to date, or 44 percent.
Swiss manufacturer Pilatus shipped
27 aircraft in the quarter, consisting of 20 PC–12 single-engine turboprops,
six of its new PC–24 jets, and one STOL workhorse PC–6 Porter. The company has
shipped 62 airplanes to date.
Among the 65 singles, twins, and
M-class variants shipped by Piper in the third quarter were 34 PA–28–181 Archer
III airplanes, as Piper pursued its declared strategy of focusing on the flight
training marketplace. The activity brought the total of aircraft shipped so far
this year to 152.
The year’s trend continued in
Textron Aviation’s Cessna unit, where shipments of Skyhawk SP (30) piston
singles and Grand Caravan EX (21) turboprops led the way. Thirteen Citation
Latitude jets shipped in the quarter, with the three models combining to
account for 64 percent of Cessna’s 110 total third-quarter shipments.
Bell 505 Jet Rangers, the Leonardo
AW139, and Robinson Helicopters’ R44 piston and R66 turbine models showed
strength among rotorcraft, with the Robinson piston helicopter models and
variants representing the majority of the increased rotorcraft deliveries, GAMA
noted for the period.
Airbus: Fleet
in Russia and CIS to double by 203715
According to Airbus’ Global Market Forecast, unveiled at the
Wings of the Future conference in Moscow:
Russia and CIS’s airlines will
need some 1220 new aircraft valued at US$175 billion in the upcoming 20 years
(2018-2037).
This means that the passenger fleet
in the region will almost double from 857 aircraft in service today to over
1700 by 2037.
Over the next 20 years, passenger
traffic in Russia and CIS region will grow at the average rate of 4.1% annually
with Russia being the major contributor to this growth.
By 2037 the propensity for air
travel in Russia will more than double.
Facts about
the FAA and Air Traffic Control16
At
any given moment there are more than 5,000 aircraft traversing the U.S. skies.
The
FAA is a year-round 24/7 operation, responsible for 5.3 million square miles of
U.S. domestic airspace and 24 million square miles of U.S. airspace over the
oceans.
There
are 43,290 average daily flights in and out of the U.S.
More
than 14,000 air traffic controllers manage traffic from many of the FAA’s 700
facilities.
Fifty-five
hundred airway transportation system specialists maintain more than 70,000
pieces of equipment.
Aviation
contributes $1.6 trillion annually to the U.S. economy and constitutes 5.1
percent of the gross domestic product.
Aviation
generates 10 million jobs in the U.S. annually.
Global
survey reveals anticipated significant growth in aviation jobs18
IATA has revealed the results of a global survey of over 100
leading industry HR professionals at airlines, airports and ground service
providers, carried out by Circle Research to learn more about how HR decision-makers
were managing the retention, training and recruiting of skilled professionals
to fill the anticipated job gaps.
In brief, the results of the report showed that:
More than 73% of respondents
expect the major areas of job growth to be in ground operations, customer
service and cabin crew.
48% reported that finding new
talent is a challenge, through lack of availability of candidates with the
right skill levels and qualifications, plus salary demands of new applicants.
In addition to the salary and benefits
package of each employee, the HR professionals identified career progression
opportunities (49%) and development and training (33%) as high priorities in
job satisfaction and retention.
Only 28% of respondents reported
that current training is effective, with many organizations seeking to
complement their in-house training with external partners to improve the
effectiveness of the training.
Safety and customer service skills
are priorities for hiring managers across the industry. While technology is
indeed changing the customer service role, it is not replacing it.
Approximately 75% of respondents
expected an increase in customer service, ground operations and cabin crew jobs
over the next two years.
That is higher than the 65% of
respondents that expect growth in security jobs and 63% that expect growth in
regulatory positions.
And you
though your travel budget was high?Source noted
Russian Military Aircraft Fleet19
New
Entrants for Electric Propulsion20
Almost 100 electrically propelled
aircraft are in development worldwide.
60% of these are being conducted by
startups, the rest are traditional aerospace incumbents.
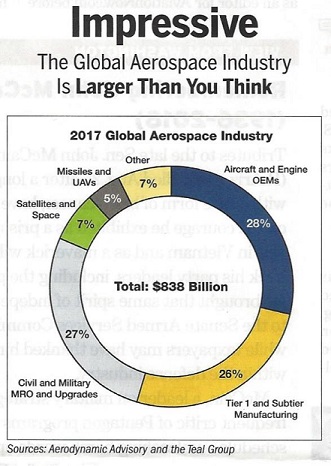
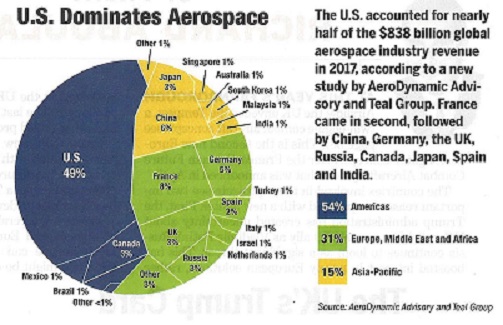
How Large is the Global Aerospace Industry? 21
Africa becoming new opportunity continent for emerging
airlines22
According to the data from IATA,
Africa is home to 16% of the world’s population but it accounts for only 2.20%
of the global air service market.
According to data available from IATA
the Revenue Passengers Kilometer (RPK) grew by 6.3% and the Freight
Tonne-Kilometres (FTK) grew by 24.8%, the highest of any continent.
Yet, despite these good numbers put up
by Africa indicating strong growth, its traffic share of total passengers
remains the lowest of any continent at only 2.20% of the world share. The
passenger traffic share trend is improving however, compared to 2016 African
airlines saw a 7.5% traffic rise in 2017 but with existing infrastructure capacity
rose at less than half the rate of demand.
By 2026 passenger numbers are expected
to increase from 100 million to more than 300 million. This explosive growth
corresponds to 5.9% year-on-year growth.